System inspector
The System Inspector gives you real-time visibility into your Companion Hub machine — resources, containers, ports and storage — from the browser.
Opening it
Go to Settings → System in the Hub dashboard. The Hub stack and maintenance controls sit at the top of that tab, and the inspector is below them. On a narrow screen the row of Settings tabs scrolls sideways, so swipe the row to reach System.
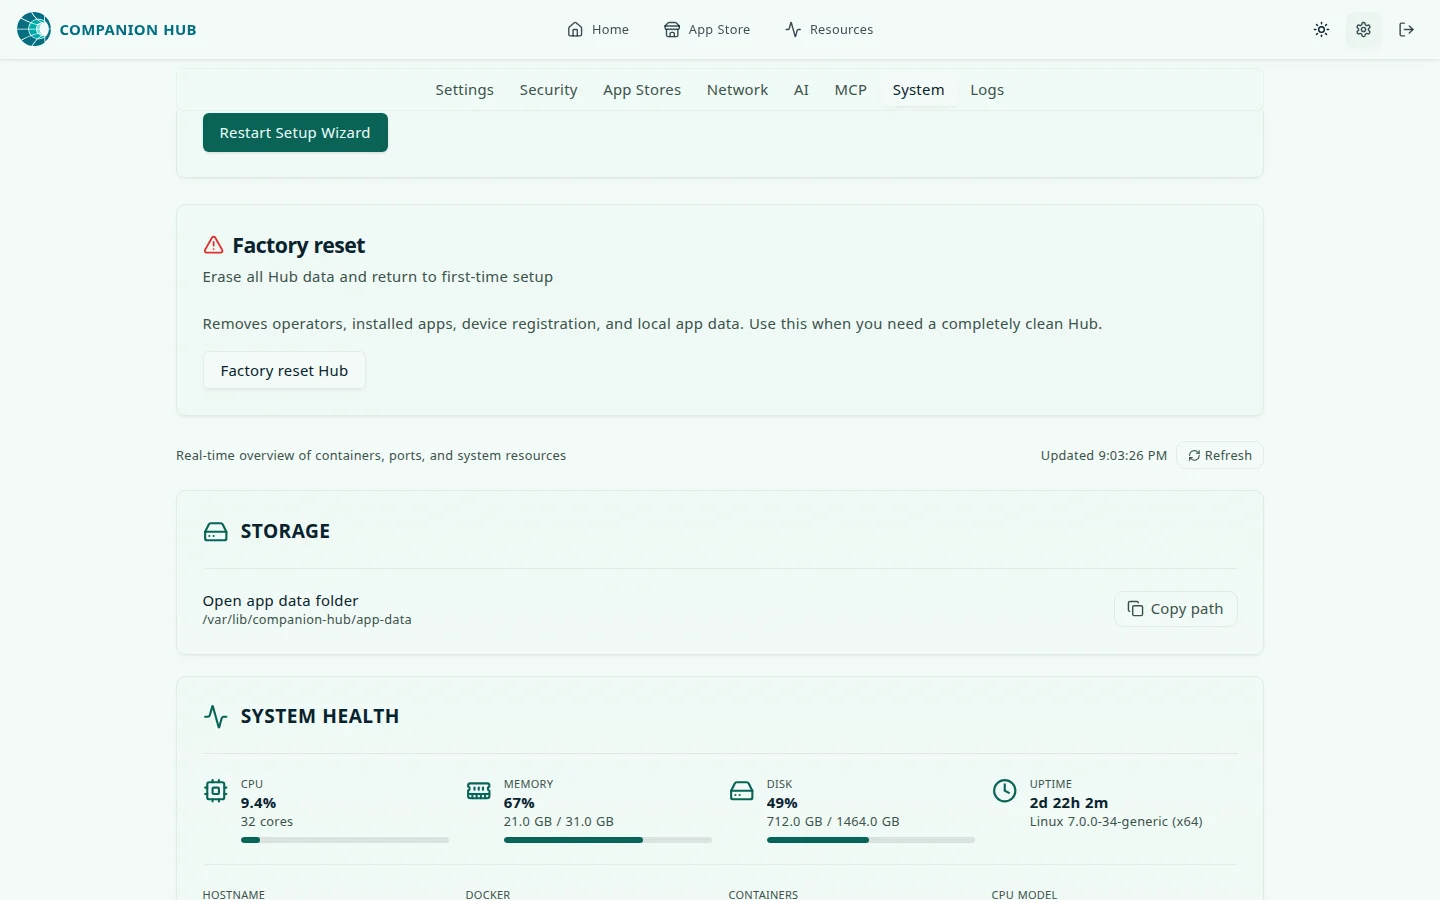
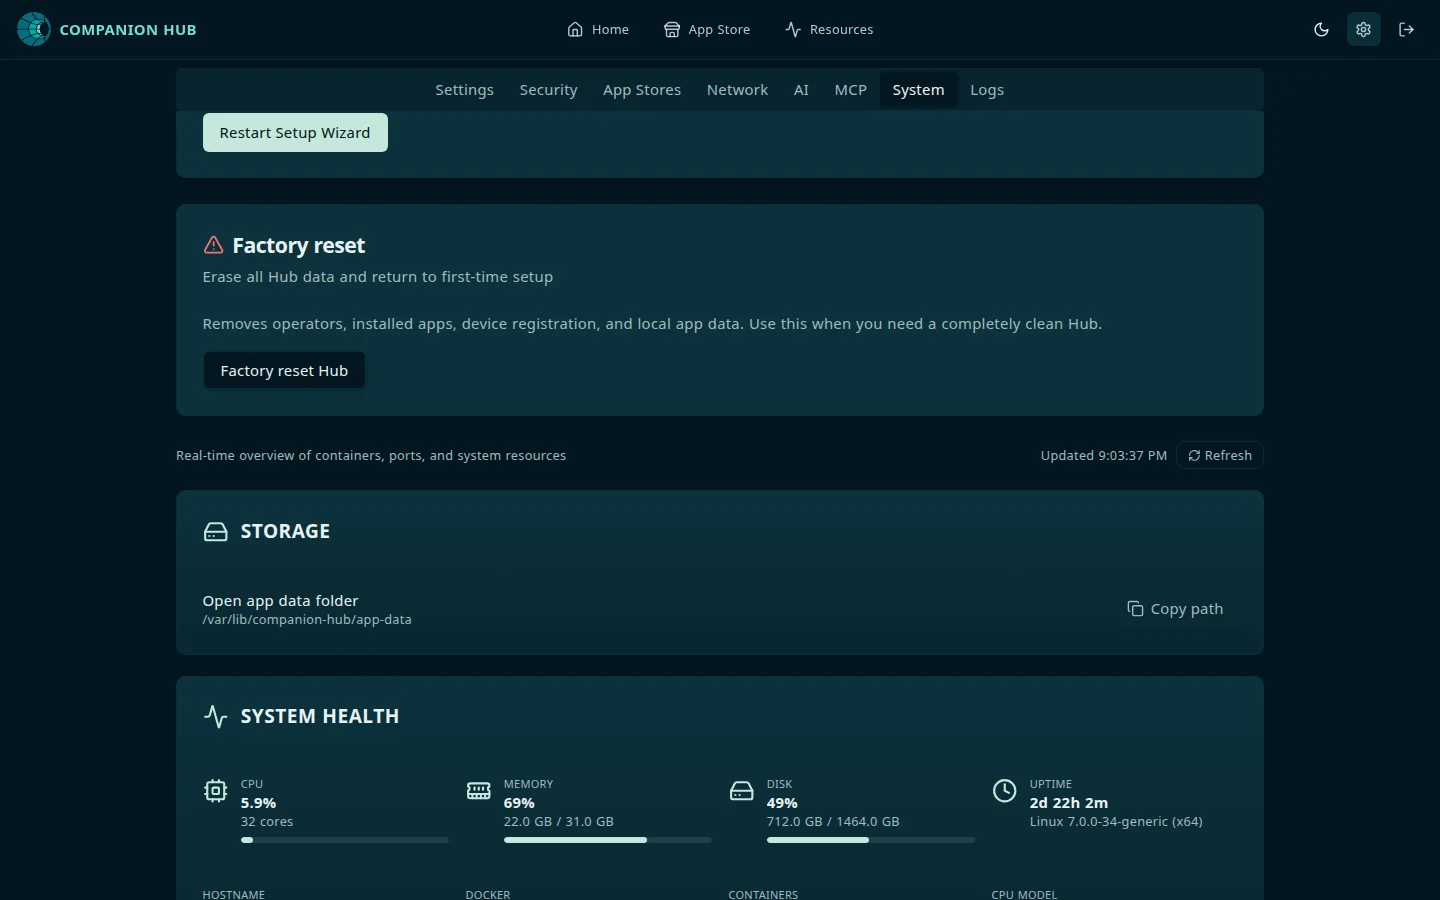
The page polls every 5 seconds while it is open and includes a Refresh button for an immediate re-read.
The five sections
Everything the inspector shows sits on one tab and refreshes on the same 5-second poll:
flowchart LR
    S["Settings → System<br/>polls every 5 seconds · Refresh re-reads now"]
    S --> R["Host vs. container resources<br/>physical host vs. Docker VM · recommended Docker memory · VM wedge badge"]
    S --> H["System health<br/>CPU · memory · disk · uptime · Docker version · container count · CPU model"]
    S --> C["Docker containers<br/>status · uptime · owning app · System for containers Hub did not start"]
    S --> P["Port allocations<br/>host port → container · allocated vs. bound · Untracked toggle"]
    S --> D["Storage<br/>app data path · Open app data folder in the desktop app, or Copy path"]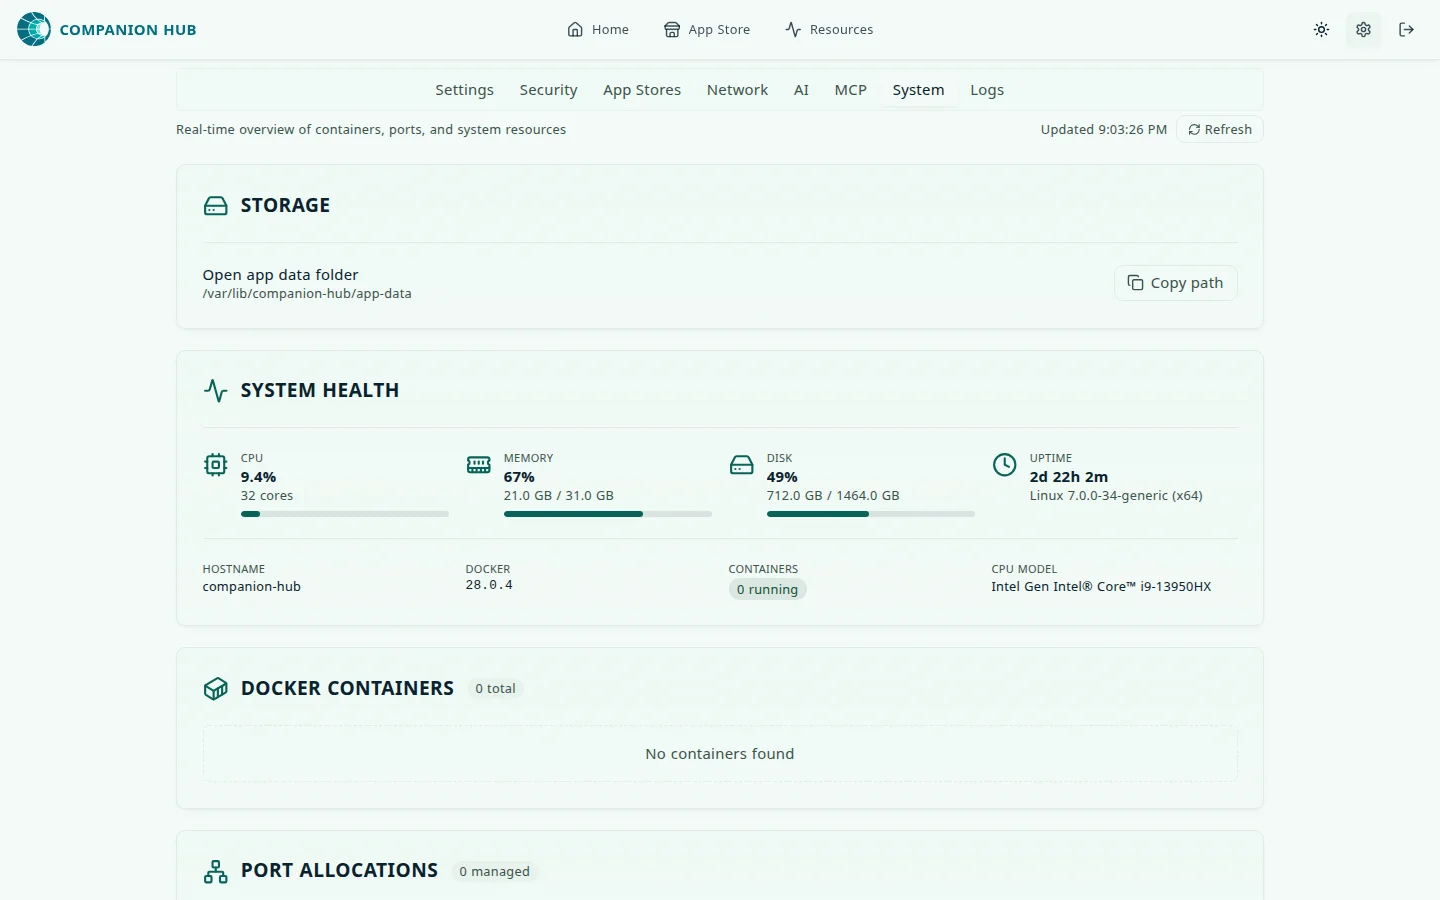
Host vs. container resources
This section separates the resources on your physical host from the resources allocated to the Docker VM. On macOS and Windows, those numbers differ, and the Docker VM allocation limits your apps.
It shows Hub’s recommended Docker memory for this machine, says whether automatic Docker memory tuning is on, and flags a VM wedge detected badge when the Docker VM enters an unhealthy state.
System health
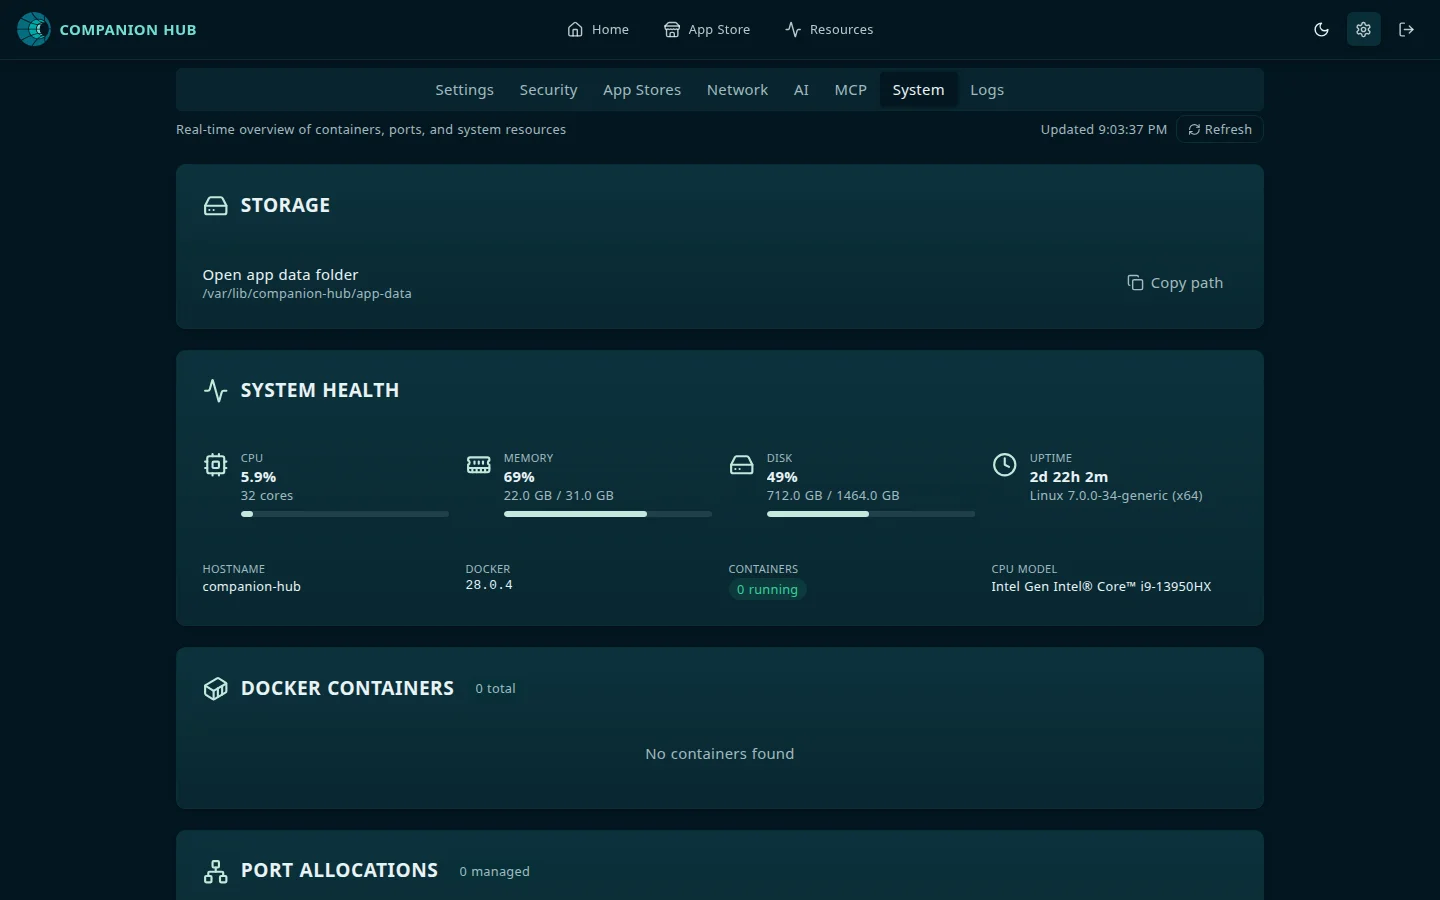
Live figures as stat cards:
- CPU load, as a percentage
- Memory used, as a percentage
- Disk used, as a percentage
- Uptime, with the host platform underneath
Below those: the machine’s hostname, the Docker version, a container count split into running and stopped, and the CPU model.
Docker containers
Every container on the host with its status, image, ports, uptime, and the Hub app it belongs to — containers Hub did not start are labeled System. The image column drops off at narrower widths, and so do ports, uptime, and the app column.
Port allocations
What is bound where. Each row gives the host port, the container it maps to, protocol, label, app and container name, and distinguishes a port that is allocated but not bound from one that is bound and active.
Ports in use on the machine that Hub did not allocate are listed separately as Untracked behind a toggle — which is how you find the thing that is holding the port your app wanted.
Storage
Shows the host path of your app data folder. Inside the desktop app it also offers an Open app data folder button. In a browser there is no folder to open, so the same place shows a Copy path button that copies the path instead.
Apart from Refresh and the folder and path buttons, the System Inspector is read-only. To start, stop, or restart one app, open its page from Home. To act on every app at once, use Batch actions on Home.
Resource Monitor
The inspector shows what is on the machine right now. The Resources item in the dashboard’s top navigation opens the Resource Monitor, which shows how your apps, your inference engines, and the Hub use the machine over time. It is arranged in bands:
- Workloads on this machine charts CPU by workload and GPU memory by workload, and shows the prompt and output tokens that inference calls from this Hub have used, broken down by model.
- This machine shows the host’s CPU and memory, the model memory budget for your inference engines, and the machine’s containers.
- The pool in use shows the paired Hubs this Hub can send work to and a log of where recent requests went. It matters only when you use Hub Pool.
- What the pool offers lists the AI models this machine holds and the models reachable across the pool.
- Configuration is a collapsed section that lists settings needing attention, such as your pool and cloud-provider setup.
GPU memory per workload needs a host probe that reads nvidia-smi or
rocm-smi. Where the probe is absent, the rows show gaps instead of zeros.
Apple GPUs expose no per-process memory to any tool, so on a Mac those rows
stay empty.